

Numbers your team can act on
We turn the records you already keep into dashboards and reports that show what is working, what is slipping, and what to do next.
From raw records to clear answers.
Raw records become useful when they are cleaned, organised and shown to the right people at the right time.
One screen for how the business is doing
Live dashboards built from the records you already keep, so sales, orders and costs are in one place instead of five spreadsheets.
- Real-time dashboards
- Updated automatically from your systems
- Filters by outlet, team or date
- Works on desktop and phone
Yesterday’s numbers, before your first tea
Daily and weekly reports that arrive by themselves, with the few things that deserve attention pointed out in plain words.
- Scheduled daily, weekly or monthly
- Changes compared with last period
- Short notes on what is unusual
- A link to the full dashboard
Charts that are easy to read
Interactive graphs, charts and KPIs, each chosen for the question it answers, not to decorate the page.
- Interactive and customisable charts
- The right chart for each question
- Export to PDF or Excel
- Clear labels, no jargon
Know early when a target is slipping
The handful of measures that matter for your business, tracked against targets so problems show up in week two, not at month end.
- Targets for sales, costs and collections
- On track, slipping or behind at a glance
- Alerts when a measure drops
- The same numbers for every team
From “sales are down” to why
Drill down from a headline number to the outlet, the time of day and the reason, so the fix is obvious.
- Drill down by outlet, item and hour
- Compare periods side by side
- Spot trends, risks and opportunities
- Forecasts for sales and demand
All your records in one place
Data from billing software, spreadsheets and your website is collected, cleaned and stored together, so every report starts from the same numbers.
- ETL pipelines across your systems
- A data warehouse for fast access
- Cleaned, matched and refreshed on schedule
- One version of the truth
Dashboards running in our own software
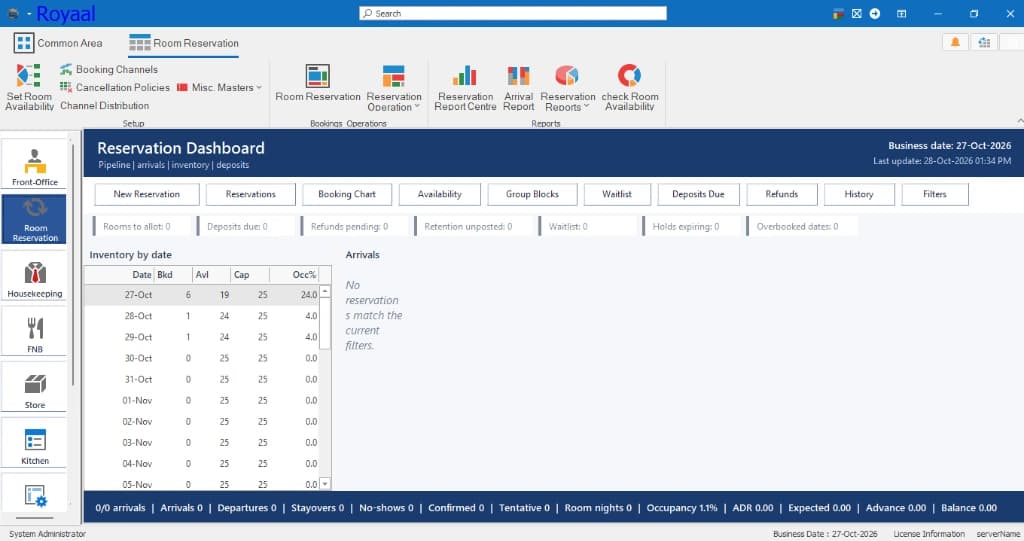
Real screens from Royaal-SD, the hotel and restaurant software we build and support.
Occupancy, arrivals and deposits at a glance
In Royaal-SD, our hotel software, the reservation dashboard shows inventory by date, occupancy and a running strip of arrivals, no-shows, room nights and balances.
- Inventory and occupancy by date
- Totals that update as bookings change
- One click to the detailed report
From your questions to a dashboard you trust
in 5 stages
Scroll down and follow one project, from the questions you want answered to reports that arrive by themselves.
Data identification
We start from your business goals and the questions you want answered, then find the data that can answer them.
- The questions, written down first
- Which records hold the answers
Collection & preparation
We gather, clean and join the raw records into a form that can be analysed, so the same thing is counted once.
- Duplicates matched and merged
- One format for names, dates and units
Exploratory analysis
We look for patterns, trends and anomalies with charts and statistics, and check the odd ones before trusting them.
- Trends and seasonality
- Outliers explained, not ignored
Insight generation
We turn what the data shows into a short list of things your team can actually do, in plain words.
- Each finding tied to an action
- No jargon, no 40-page report
Visualisation & reporting
We build the dashboards and scheduled reports that keep those numbers in front of the people who need them.
- Interactive dashboards
- Reports delivered on schedule
Everything from pipeline to dashboard
Take one service on its own or the whole chain. Open one to see what it covers.
Business intelligence
Real-time dashboards and automated reports built on the records you already keep.
Data visualisation
Interactive, customisable graphs, charts and KPI views that are quick to read.
KPI tracking
Measure the performance metrics that drive growth, against targets you set.
Predictive analytics
Anticipate trends, sales and demand from your own history.
ETL pipelines
Extract, transform and load data across your systems on a schedule.
Data warehousing
Organise large data sets in one place for fast, consistent access.
Fewer guesses, faster decisions
Decisions backed by data
Choices about stock, staff and prices rest on your own records, not hunches.
Trends seen sooner
Risks and opportunities show up while there is still time to act.
Waste found
Inefficiencies and leaks become visible, and so do the savings.
Performance in real time
Dashboards show today’s position, not last month’s.
One version of the truth
Every team works from the same numbers, so meetings are about decisions.
Less spreadsheet work
Reports build themselves instead of taking someone’s Monday morning.
From a spreadsheet to a data warehouse
We pick the lightest tool that answers your questions well, and grow it only when your data does.
Where would you like to start?
Begin with one dashboard, bring all your data together, or just talk it through.
A dashboard for one team
Start with the numbers one team needs most.
- The questions agreed in writing
- Connected to your current records
- A live dashboard on desktop and phone
- A scheduled email report
- Room to add more later
Bring all your data together
For businesses with records spread across several systems.
- Pipelines from every source
- A data warehouse
- Dashboards for each team
- KPI targets and alerts
- Access set by role
A consultation, at no charge.
- Tell us what you want to know
- Show us the records you keep
- Hear what we would build first
- No obligation to go ahead
Questions we hear a lot
Want numbers your team can act on?
Tell us what you want to know. We will reply with a practical plan, a realistic timeline, and a price you can understand.